At first, we learnt what a cell was, I understood that it was quite similar to coordinates, for example, this is the cell C275:
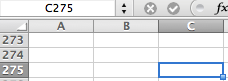
It is shown in the square above when you click on the cell and the letter C and the number 275 are both highlighted.
After that we learnt how to present our questions in a graph, first, we have to write down the answer options in cells next to each other. For example, these are the options to my first question, "What is Web 2.0? Because I have asked three different age groups, I must have three different sets:

Next, we learnt how to type in our data. To do this, I had to write 1 for the each option they chose and 0 for the rest. This is an example from my first question:

After that, before presenting the data in a graph, we learnt how to use the COUNTIF function. It enables you to count how many of a criteria you have in a certain range. In this case, the criteria would be 1. Here is a step by step process of how I used the COUNTIF option:
First, I typed =countif directly in the cell below the range:

Then, I opened a bracket and selected the range:

After that, I typed in the criteria (1) and closed the brackets:

And thats it, I pressed enter and it calculated the total, this is all three done:

After calculating the total for each year, I learnt how to present the data in a graph. First, I selected the the options, and the totals, then I chose the Pie graph option in the Charts section, and then I chose it to show the percentage. This is a step by step process of how I did this, including a picture of the outcome:


Overall, I enjoyed this experience very much. I learnt how to create graphs in detail and it will really help to covert the data of the questionnaires into graphs in excel as it is easy and interesting to do.
No comments:
Post a Comment